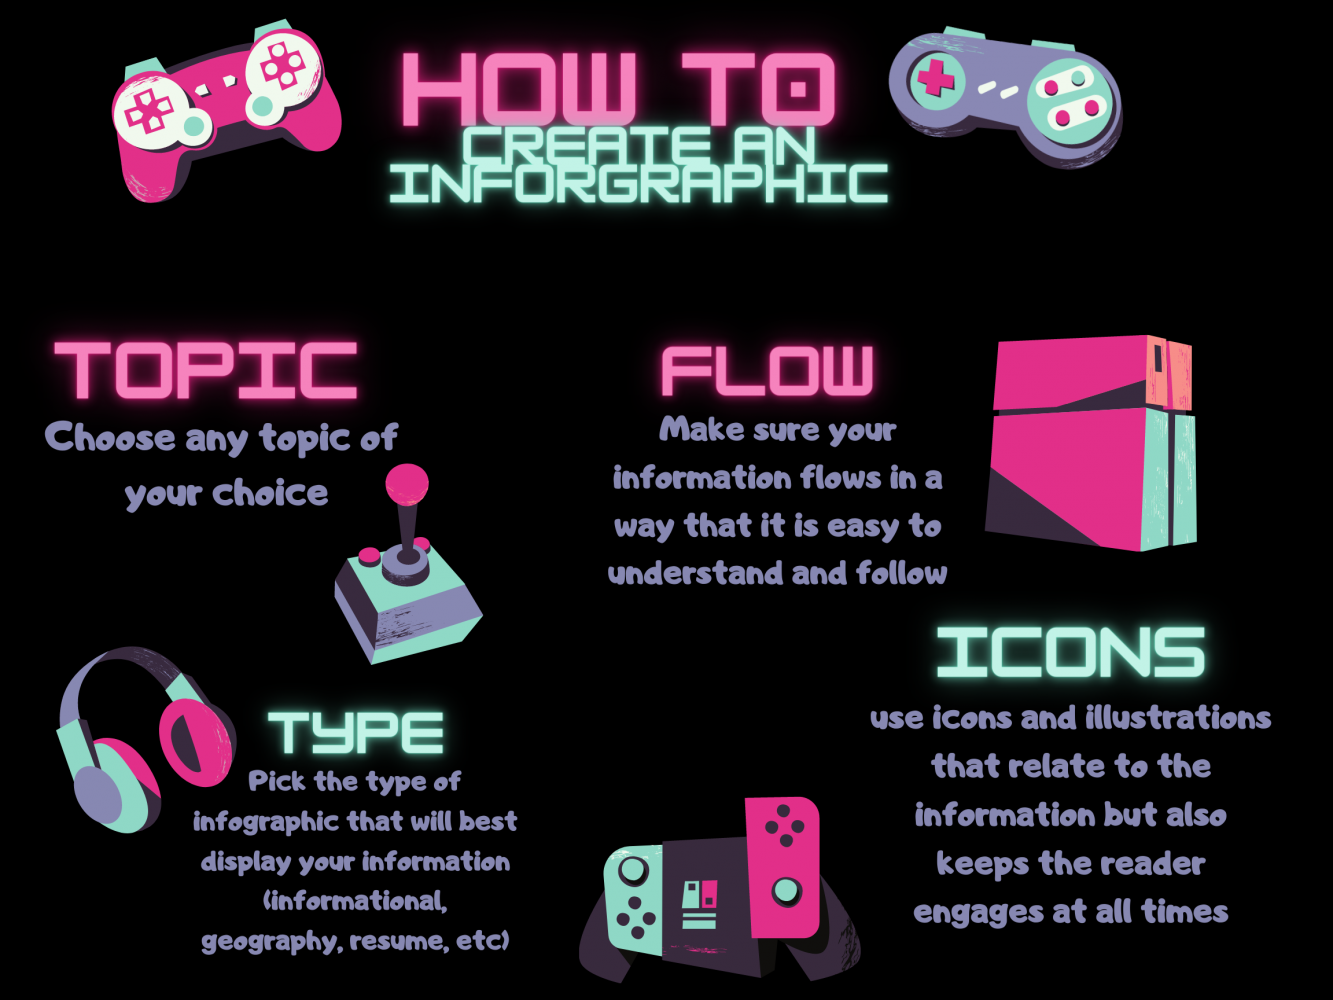
Typically infographics are used to display information visually such as statistics, a process, or even a resume. Graphic Design II teacher Rosarita Olvina is teaching her students the creative aspect of making infographics.
Students were tasked with creating an infographic on a topic of their choice using one of the nine different types taught in class, such as informational, statistical, or geographical to display their research.
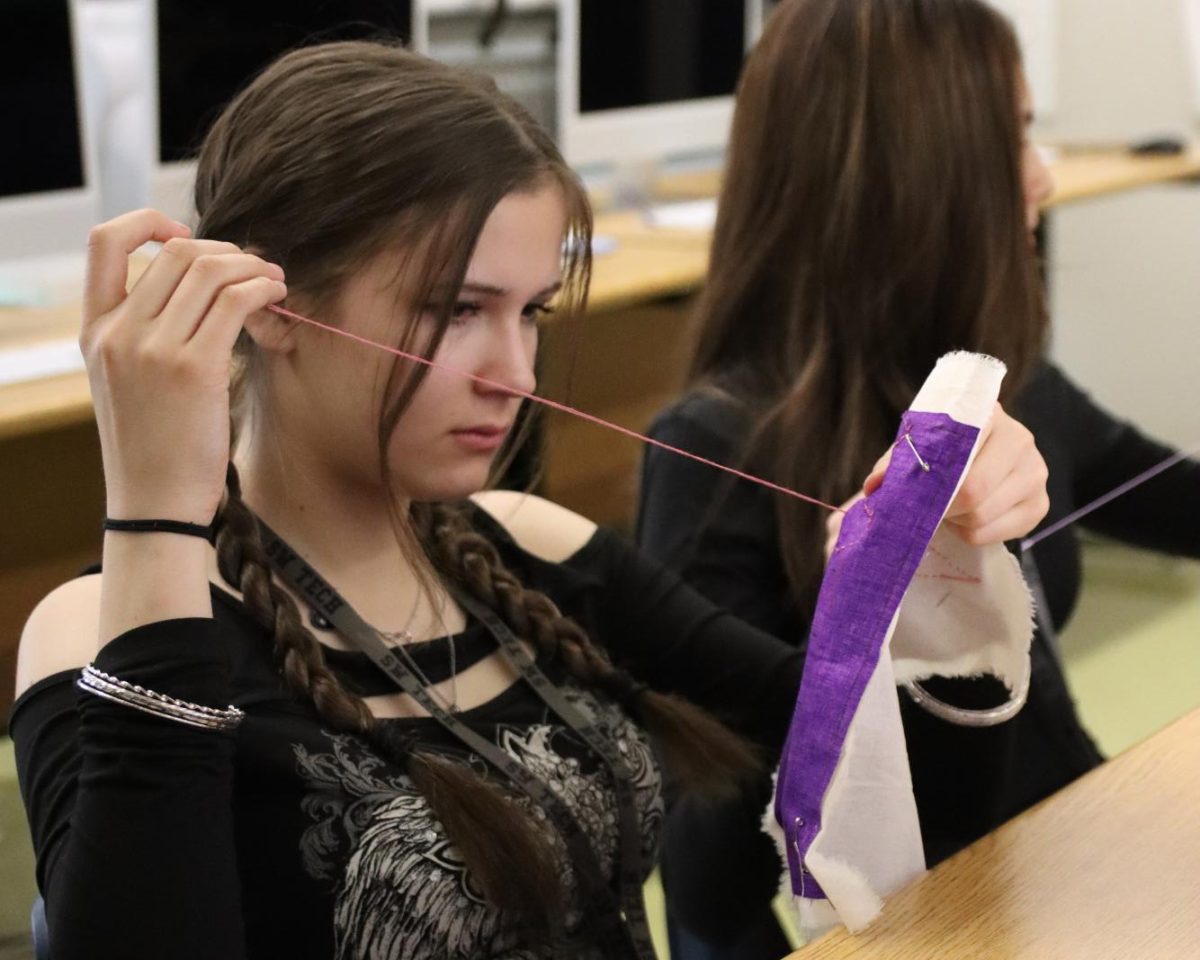
“I picked the importance of mental health for my infographic because I feel as though many people lack the knowledge of it nowadays,” junior Fashion Design student Marissa Farkas said, “I feel our humanity is lost when our mental state is low. We end up losing our sense of self and worth when we don’t take our own mental health seriously.”
Olvina wants students to use their creativity so the reader is engaged with the subject matter. Students are expected to be intricate with colors, illustrations, font styles, etc. to earn the best possible grade.
“I plan on using a statistical infographic to display my information with graphic statistics like pie charts, bar graphs, etc,” junior Fashion Design student Michelle Nguyen said, “Just so I can make it visually clear the issue I am portraying through my graphics and make my information easy to follow for my readers.”
Students are choosing topics, such as the effects of ADHD effects, different hairstyles black people wore over the decades, or explaining what the idea of Visual Attention Software is.
“I think this project will be more on the easy side and be a lot of fun doing since I get to personalize my infographic with my style,” junior Gabbi Barber said, “But I think the most challenging part will be finding which way is best for displaying my information since there are so many layouts to choose from, it’s overwhelming.”
Olvina wants students to learn how to make information look more interesting by using their creativity, so students can share their information and educate others on what they are passionate about.
“I look at this assignment as a way to share information with others,” Barber said, “It’s a new and fun way to grab people’s attention and keep it all while talking about something you care so much about.”


![Construction continues at Little China Plaza, located west of Southwest CTA. The project moves toward its expected completion in late 2026. “It’s a cool opportunity to see and know more businesses, because there’s already a new Urban Matcha here,” senior Roman Maynigo said. “I just think [it’s amazing] of the practicality of [everything] in the area.](https://southwestshadow.com/wp-content/uploads/2026/05/Screenshot-2026-05-08-103248.png)